On Board Signal Processing
The Brain of the Cyranose® 320
by: Jing Li
On board signal processing for Cyranose® 320 is described in this paper. The whole signal processing includes preprocessing, post-processing and algorithms utilization. The data generated by the electronic nose - Cyranose® 320- is a set of relative changes of the resistances of the polymer composites during the exposure to the odor. The raw data is filtered, reduced, normalized and scaled after is collected. The pre-processed and post-processed data is further analyzed by Cyrano's proprietary algorithms for the descriptive results.
Introduction
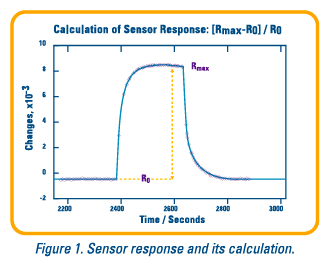
The Cyranose® 320 contains an array of 32 polymer composite sensors. Exposure of these sensors to chemical vapors causes a change in their conductivity, which is recorded as resistance. The collected raw data is filtered using the Savitsky-Golay method in order to minimize high frequency noise. The filtered data is then reduced to a relative change of the resistance caused by the exposure to a vapor using a baseline correction method. This relative change of the resistance for a particular sensor represents its response (Figure 1). A smellprint (or pattern) is generated from the reduced data for all 32 sensors. The next step is post-processing in which the normalization and scaling techniques are applied to the pattern. For the pattern recognition, there are three multivariate linear discriminant analysis techniques available on board the Cyranose® 320. They are K-nearest neighbor (KNN), K-means and Canonical Discriminant Analysis (CDA).
Signal Pre-processing
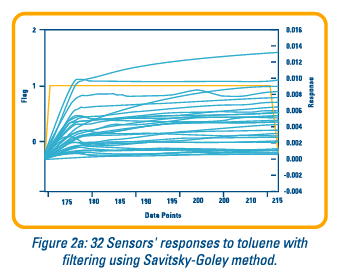
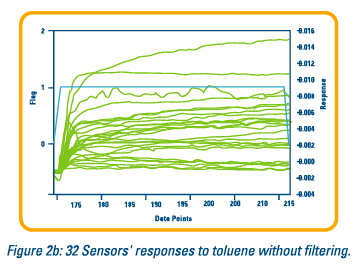
Resistance measurements such as those collected by the Cyranose® 320 are always accompanied by high frequency noise. Because the signal to noise ratio (SNR) is crucial for pattern recognition, especially when the concentration of sample is low, it is important to boost the signal relative to the noise using the digital filtering techniques. These techniques also can help to improve the repeatability of exposures. On board the Cyranose® 320, the Savitsky-Golay filter is used to smooth the response curve using a polynomial fit. Currently the filter window is set to give the best smoothing without significant distortion. Figure 2a shows the responses after filtering and Figure 2b shows the responses without filtering.
The filtered data is reduced using a baseline correction method, guided by the flags indicating the state of the instrument. The base resistance (Ro) is calculated by taking an average of data points before the sample exposure. The average maximum resistance (Rmax) during the sample exposure is calculated using the absolute maximum of the resistance. The response of a sensor is defined as

Signal Post-processing
After signal pre-processing, the responses of 32 sensors are obtained. A histogram of these responses forms a pattern, or smellprint, for a particular sample (or a smell). The responses of 32 sensors can be normalized using a simple weighting method as follows:

The normalized data is then autoscaled or mean centered. Autoscaling to unit variance removes any inadvertent weighting that arises due to arbitrary units (in the electronic nose area, this will be the vastly different samples). Mean centering simply centers the data around the origin.
The pre-processed and post-processed data is now ready for pattern recognition.
Pattern Recognition Algorithms
Unlike the conventional analytical techniques, the electronic nose takes full advantage of the techniques in mathematics, statistics, and computer science to extract valuable, but often hidden, information directly from the measurement.
Pattern recognition algorithms are very powerful tool to deal with a large set of data collected from the electronic nose. The Cyranose® 320 uses principal component analysis (PCA) and three algorithms for building a model and predicting the unknowns. These three algorithms are K-nearest neighbor (KNN), K-means and Canonical Discriminant Analysis (CDA).
CDA requires square matrices in its calculations. This means that the number of exposures of each sample should be equal to the number of sensors used in the electronic nose. Since there are 32 sensors in the Cyranose® 320, 32 exposures for each sample would normally be required. It is very difficult for customer to do that many exposures for each sample class to build up a model, especially if the customer has many sample classes. In order to avoid this problem, a PCA is done prior on the data set to convert the useful information into several principal components. Ten exposures of each class are recommended. The number of exposures minus one is the number of principal components that will be used for CDA to build a model, since cross validation will be implemented.
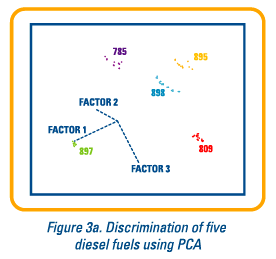

A comparison of different algorithms was done on the discrimination of the diesel fuels. Five diesel fuels are very different from the relative positions in the 3D PCA plot (see Figure 3a). Each diesel was tested 8 times from 8 vials. The repeatability of each diesel is good. The data was also analyzed using canonical discriminant analysis (see Figure 3b). Actually, the data was analyzed using PCA first. Then, PCA provides 7 principal components (factors). These 7 factors were input to the Unistat® program for doing the canonical discriminant analysis. From the canonical plot, we can see that these five diesel fuels are tightly grouped and well separated.
Conclusion
The use of multivariate techniques is very complex, which requires skill in statistics and applied mathematics. The Cyranose ®320 relieves the operator of this burden by incorporating pattern recognition analysis into the instrument as well as different post-processing techniques.
